Key Points
• Indonesia’s trade balance surplus of USD5.49 billion in August 2025 was supported by non-oil and gas commodities such as vegetable oil and steel.
• The cumulative surplus from January to August 2025 reached USD 29.14 billion, with non-oil and gas commodities recording a surplus of USD 41.21 billion and oil and gas commodities recording a deficit of USD 12.07 billion.
• The largest surpluses were recorded with the US, India, and the Philippines, while the highest deficits were recorded with China, Singapore, and Australia.
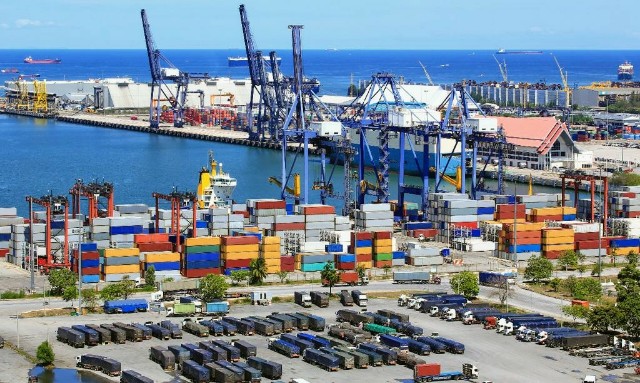
Jakarta – The Central Statistics Agency (BPS) reported that Indonesia’s trade balance in August 2025 recorded a surplus of USD5.49 billion.
“Indonesia’s trade balance has recorded a surplus for 64 consecutive months since May 2020,” said Deputy Head of Production Statistics at BPS, M. Habibullah, at a press conference at the BPS Headquarters in Jakarta on Wednesday, October 1, 2025.
Habibullah explained that the August 2025 trade balance surplus was supported by a non-oil and gas commodity surplus of USD7.15 billion.
The main commodities contributing to the surplus were animal/vegetable fats and oils, mineral fuels, and iron and steel.
Meanwhile, the oil and gas trade balance recorded a deficit of USD1.66 billion, mainly due to imports of crude oil and petroleum products.
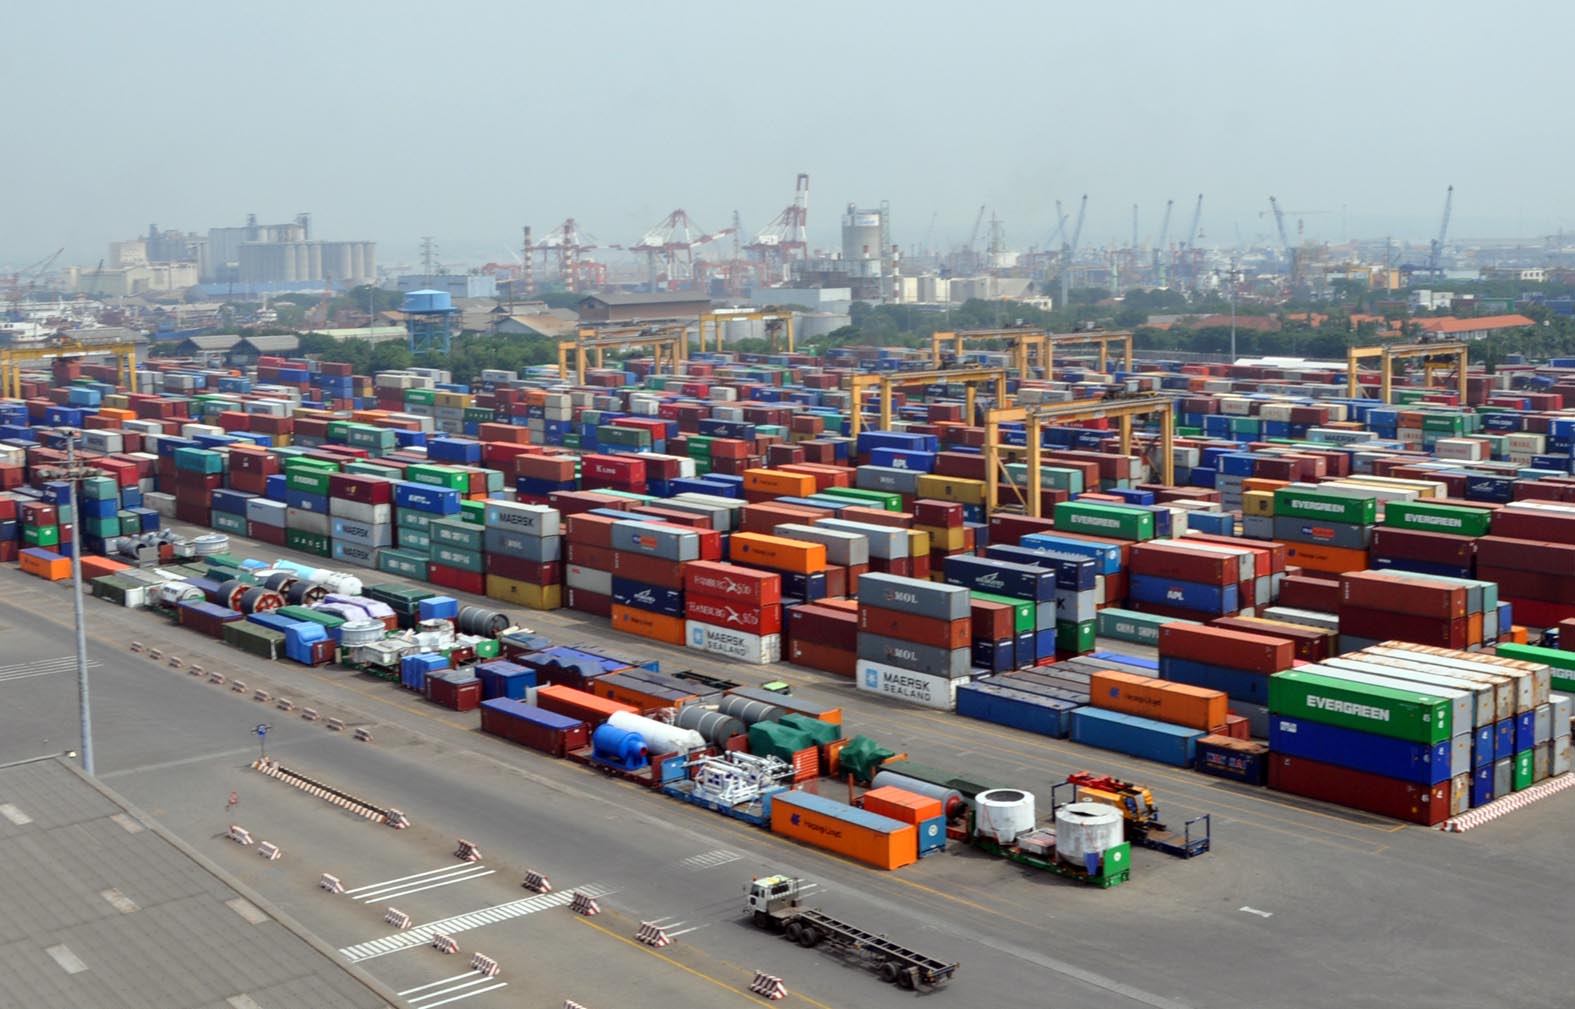
January-August 2025 Surplus Reaches USD 29.14 Billion
Cumulatively, Indonesia’s trade balance for January-August 2025 recorded a surplus of USD 29.14 billion, with a non-oil and gas surplus of USD 41.21 billion and an oil and gas deficit of USD 12.07 billion.
The three countries with a surplus in Indonesia’s trade balance were the United States (US) with a surplus of USD 12.20 billion, India with a surplus of USD 9.43 billion, and the Philippines with a surplus of USD 5.85 billion.
Meanwhile, the three countries with the largest deficits were China with a deficit of USD 13.09 billion, Singapore with a deficit of USD 3.55 billion, and Australia with a deficit of USD 3.49 billion.
More specifically, the three countries contributing to the non-oil and gas surplus are the US with a surplus of USD 14.09 billion, driven by commodities such as electrical machinery and equipment and parts, clothing and accessories (knitted), and footwear.
This is followed by India with a surplus of USD 9.47 billion with commodities such as mineral fuels, animal/vegetable fats and oils, and iron and steel.
Then, the Philippines had a surplus of USD 5.81 billion with commodities such as vehicles and parts, mineral fuels, and animal/vegetable fats and oils.
Meanwhile, the three countries contributing to the non-oil and gas deficit were China with a deficit of USD 14.32 billion, with commodities such as machinery and mechanical equipment and parts, electrical machinery and equipment and parts, and vehicles and parts.
Furthermore, Australia experienced a deficit of USD 3.05 billion, with the main commodities being cereals, mineral fuels, and metal ores, slag, and ash.
Meanwhile, Brazil had a deficit of USD 1.09 billion, with commodities including food industry waste and residues, sugar and confectionery, and cotton. (*)
Editor: Yulian Saputra